Practical Pilot Deployments with AI Cost Firewall v0.1.9
AI Cost Firewall began as a lightweight OpenAI-compatible gateway designed to reduce LLM cost and latency through exact and semantic caching. Over time, the project evolved beyond simple request reuse and gradually became a broader operational layer for AI infrastructure.
Recent releases introduced semantic cache lifecycle management, provider flexibility, improved Prometheus and Grafana observability, configuration diagnostics, and detailed cost accounting. Those features improved the technical capabilities of the system significantly, but another important question remained:
How quickly can somebody actually deploy and evaluate the system in a real environment?
That question became the main focus of v0.1.9.
Unlike earlier releases that concentrated on internal infrastructure features, v0.1.9 focuses primarily on operational polish. The goal of this release is to reduce the friction between discovering the project and successfully running it with dashboards, cache reuse, and observable semantic behavior.
In practice, this means clearer deployment patterns, better onboarding, improved startup diagnostics, more actionable provider error messages, and significantly expanded operational documentation.
A Shift Toward Real Deployments
One recurring observation during development was that many evaluation problems were not caused by semantic cache logic itself. Instead, the most common issues were operational:
- wrong provider base URLs
- Docker networking confusion
- embedding dimension mismatches
- empty dashboards
- TLS and certificate problems
- misunderstanding how semantic cache behaves
These are normal operational problems for infrastructure software, but they become barriers when somebody is evaluating a project for the first time.
v0.1.9 therefore introduces a more deployment-oriented structure for the repository and documentation. The project now includes runnable deployment examples under:
deploy/examples/
The new examples are designed to demonstrate practical deployment patterns instead of only isolated configuration snippets.
Included examples:
| Deployment Pattern | Purpose |
|---|---|
openai-cloud/ | Fastest cloud evaluation |
local-ollama/ | Fully local OpenAI-compatible stack |
hybrid-openai-local-embeddings/ | OpenAI chat + local embeddings |
openrouter/ | OpenRouter upstream example |
local-full-stack/ | Full local stack with dashboards |
Each example includes a runnable Docker Compose stack, minimal configuration, example requests, expected behavior, and optional observability overlays where appropriate.
The intent is not only to make deployments easier, but also to make them more understandable.
A Practical Hybrid Deployment
One particularly useful deployment pattern introduced in the examples is:
hybrid-openai-local-embeddings/
This deployment combines cloud chat inference with local embeddings.
In this setup:
- OpenAI handles chat completions
- Ollama generates embeddings locally
- Redis stores exact cache entries
- Qdrant stores semantic cache vectors
This pattern is interesting because it demonstrates a practical middle ground between fully local infrastructure and fully cloud-hosted inference.
Many organizations still want the quality and convenience of cloud-hosted chat models, but embedding overhead can become expensive once semantic cache traffic grows. Running embeddings locally can reduce or eliminate those costs while still preserving semantic reuse behavior.
The request flow becomes:
Application
    ↓
AI Cost Firewall
    ↓
Exact Cache (Redis)
    ↓
Semantic Cache (Qdrant + local embeddings)
    ↓
OpenAI upstream
This arrangement also keeps GPU requirements relatively modest compared to fully local chat inference stacks.
Faster Evaluation Flow
The deployment examples intentionally avoid unnecessary complexity. The objective is to help operators get from zero to a working observable deployment as quickly as possible.
A typical startup sequence now looks like:
docker compose up -d
docker compose exec ollama ollama pull nomic-embed-text
docker compose restart ai-firewall
After startup, the deployment can immediately be validated using the health and readiness endpoints:
curl http://localhost:8080/healthz
curl http://localhost:8080/readyz
A simple request can then be sent through the firewall:
curl http://localhost:8080/v1/chat/completions \
  -H "Content-Type: application/json" \
  -d '{
    "model": "gpt-4o-mini-2024-07-18",
    "messages": [
      {"role": "user", "content": "Explain Redis briefly."}
    ]
  }'
Repeated requests should begin producing exact cache hits, while semantically similar prompts may eventually reuse semantic cache entries.
The important part here is not merely that caching exists, but that the behavior becomes visible and understandable during evaluation.
Observability as a First-Class Feature
Semantic caching can easily become opaque if operators cannot see what the system is doing internally. One of the long-term goals of AI Cost Firewall has therefore been making semantic reuse behavior observable instead of hidden.
v0.1.8 introduced more advanced financial and cache metrics, while v0.1.9 improves the operational deployment and interpretation of those dashboards.
The project includes two Grafana dashboards with different purposes.
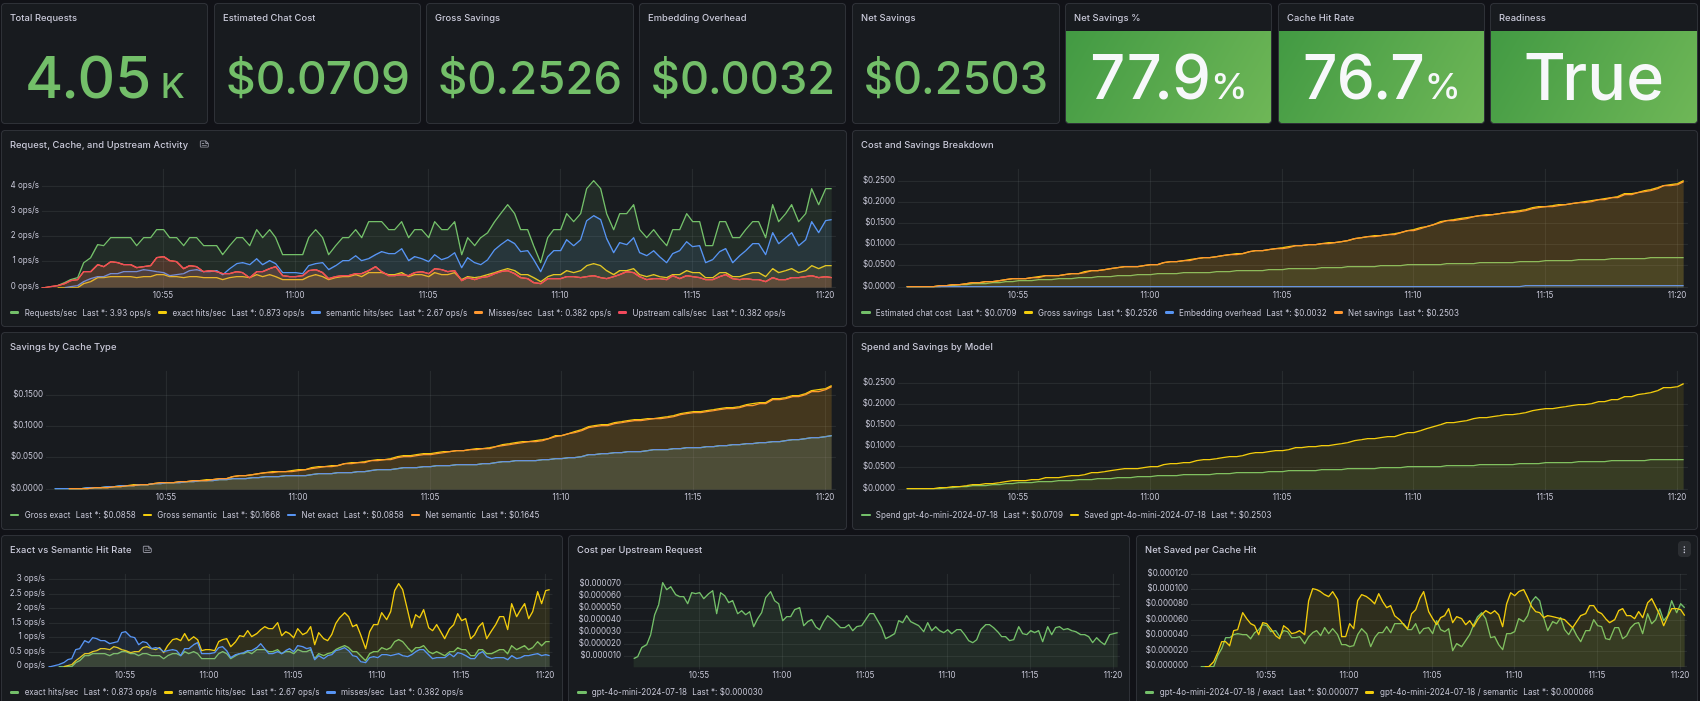
The Overview dashboard (see cover image) focuses on higher-level operational and business metrics such as:
- request traffic
- exact cache hits
- semantic cache hits
- gross savings
- embedding overhead
- net savings
Meanwhile, the Diagnostics dashboard focuses more heavily on semantic runtime behavior:
- semantic lookup latency
- threshold pass/fail behavior
- semantic candidate activity
- runtime cache diagnostics
This separation is intentional.
The Overview dashboard helps answer:
“Is this deployment actually reducing cost and upstream traffic?”
The Diagnostics dashboard helps answer:
“Why is semantic cache behaving the way it is?”
That distinction becomes increasingly important as semantic cache deployments grow larger and more complex.
Operational Problems Are Real Problems
One of the themes of v0.1.9 is that operational clarity matters just as much as architecture.
Even a technically strong caching system becomes difficult to evaluate if deployment failures are confusing or poorly explained. For that reason, this release also improves startup diagnostics, runtime validation, and provider error handling.
Several deployment mistakes appeared repeatedly during testing and evaluation.
Wrong Base URLs
A very common issue is configuring full endpoint paths instead of provider base URLs.
Incorrect:
https://api.openai.com/v1/chat/completions
Correct:
https://api.openai.com
AI Cost Firewall appends OpenAI-compatible routes internally. The same rule applies to embedding endpoints.
v0.1.9 improves diagnostics around this issue and makes related provider failures easier to interpret.
Qdrant Vector-Size Mismatches
Another common operational problem involves embedding dimensions.
Different embedding models produce vectors of different sizes:
nomic-embed-text → 768
text-embedding-3-small → 1536
If the Qdrant collection vector size does not match the configured embedding model, semantic cache behavior will fail.
Earlier releases already validated vector sizes, but v0.1.9 improves the clarity of those startup diagnostics and explains the likely cause more explicitly.
Docker Networking Confusion
Docker networking also causes frequent evaluation problems.
Inside containers:
localhost != host machine
This especially affects Ollama deployments.
Incorrect inside Compose networking:
http://localhost:11434
Correct:
http://ollama:11434
v0.1.9 expands troubleshooting documentation around these operational patterns.
Empty Dashboards
Sometimes the infrastructure is healthy but Grafana dashboards remain empty.
This is usually caused by:
- no traffic being generated yet
- Prometheus scrape failures
- dashboard provisioning path problems
- observability overlays not running
Useful checks include:
curl http://localhost:8080/metrics
and:
http://localhost:9090/targets
The release documentation now explains these scenarios more clearly.
TLS and Self-Signed Certificates
OpenAI-compatible providers are often deployed internally with self-signed certificates or non-public trust chains.
As a result, TLS problems became another recurring evaluation issue.
v0.1.9 improves diagnostics for:
- hostname mismatch
- SAN mismatch
- self-signed certificates
- TLS handshake failures
- provider connectivity failures
The objective is to make startup and provider failures more actionable for operators instead of surfacing only generic upstream errors.
Why This Release Matters
v0.1.9 is intentionally less focused on introducing major new algorithms or architectural subsystems. Instead, it focuses on operational maturity.
In practice, infrastructure software becomes useful only when people can deploy, observe, troubleshoot, and understand it quickly. That is especially true for semantic caching systems, where invisible behavior can otherwise become difficult to reason about.
This release is therefore an important transition point for AI Cost Firewall. The project is evolving from an experimental semantic cache layer into a more practical operational gateway for OpenAI-compatible AI infrastructure.
Resources
GitHub:
https://github.com/vcal-project/ai-firewall
Documentation:
https://ai-firewall.docs.vcal-project.com/